
Case Study
Increasing Revenue From Product Stacks By 371.91%
Having worked with our long-term client, an online supplement store, we’ve consistently strived to grow their revenue through our marketing strategies. However, our commitment goes beyond just delivering routine results. Beyond the performance marketing initiatives, we saw an unique opportunity to further uplift the customer experience and drive additional revenue by introducing carefully curated product stacks.
Understanding the problem
The client already had product stacks, combinations of supplements known to work well together, offering great value. However, these stacks were formed based on opinion rather than data-driven insights. Moreover, a missing centralized “Stacks” category possibly affected the visibility and potential sales.
The solution: strategy and technology
The action plan is as simple as three distinct steps in the right order.
Step 1: Identification of Efficient Product Combinations
Using Market Basket Analysis, we delved deep into the transactional data. This analysis helped unveil which products customers frequently bought together, enabling us to suggest product stacks that weren’t just based on perceptions but actual buying patterns.
Step 2: Bringing the Stacks to Life
We proactively envisioned and established the Stacks. We not only suggested the combinations but also enriched the stacks with captivating names, thorough descriptions, and engaging visuals. Our efforts aimed to resonate with the clientele, presenting them with clear benefits and unique value propositions.
Step 3: Establishing the “Stacks” Category
We collaborated with the client to centralize these offerings under a dedicated “Stacks” category. ROImonks recommended and guided the entire design of this category, ensuring ease of navigation and clarity for shoppers.
The results
Understanding the impact of our solution requires a meticulous examination of the data. Let’s delve into a comprehensive breakdown:
1. Implementation Timeline:
The new stacks and dedicated category were officially launched on July 17. As we assess the impact, this case study references the data up until August 18, offering a precise one-month analysis window post-implementation.
2. Immediate Impact (2023 Analysis)
January 1 2023 to July 16, 2023 (Pre-Launch)
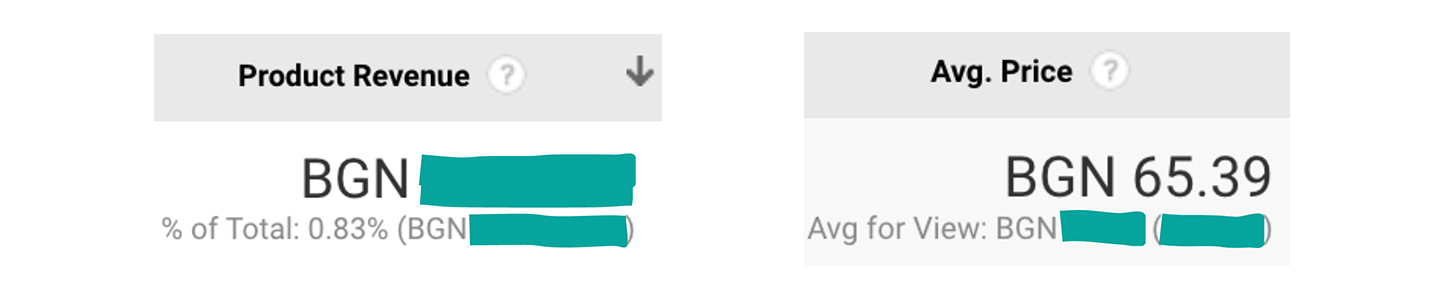
- Revenue Share from Stacks: 0.83%
- Average Order Value (AOV) for Stacks: BGN 65.39
July 17 to August 18, 2023 (Post-Launch)
- Revenue Share from Stacks: 4.34%, marking an increase of 422.89%
- Average Order Value (AOV) for Stacks: BGN 76.49, marking an increase of 16.95%

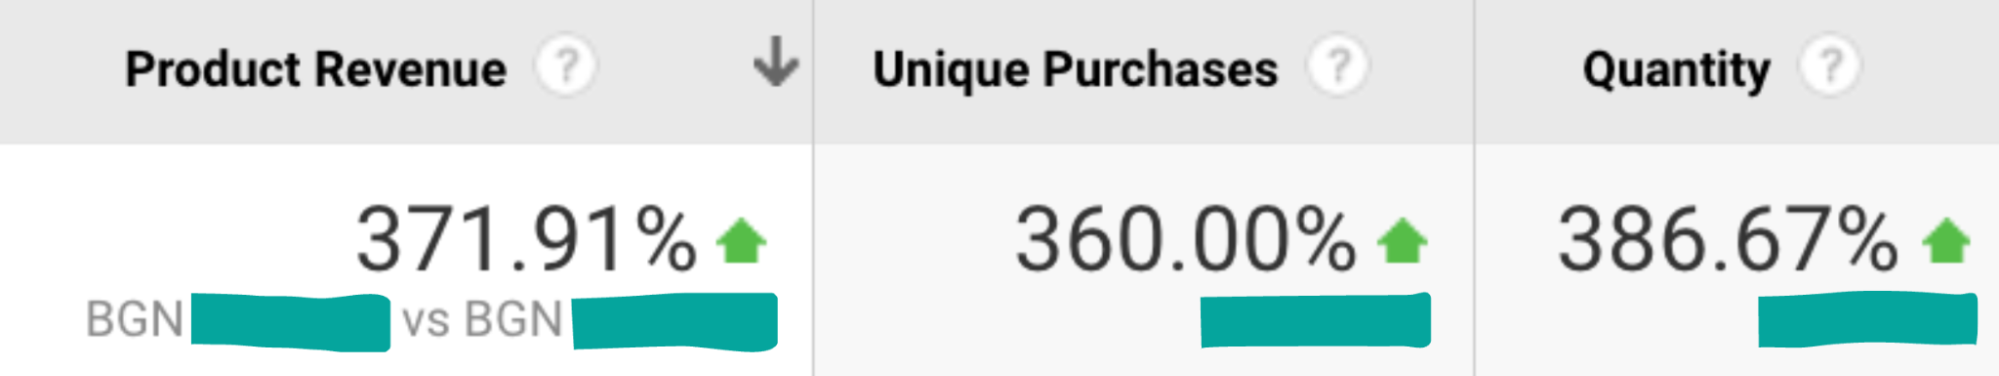
3. Year-over-Year Impact (July 17 to August 18, 2023 vs same period 2022)
For Product Stacks Specifically:
- Revenue Growth: 371.91%
- Unique Purchases Growth: 360%
- Quantity Sold Growth: 386.67%
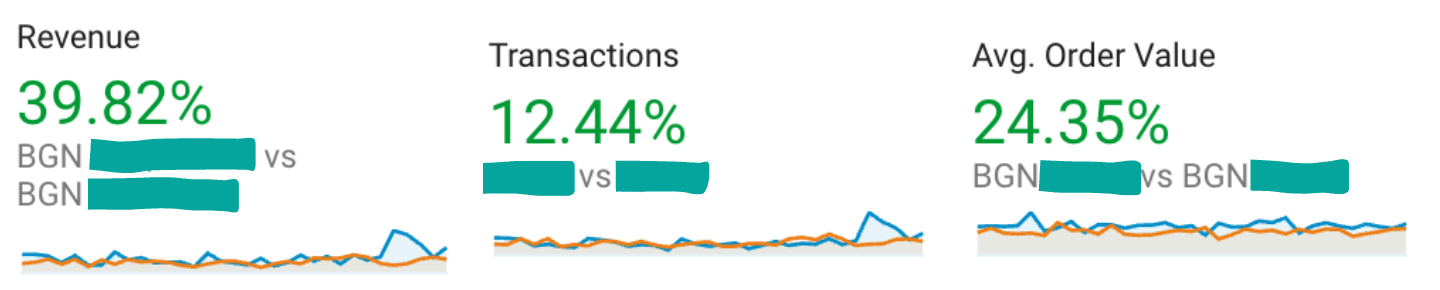
For the Website as a Whole:
- Revenue Growth: 39.82%
- Transaction Growth: 12.44%
- AOV Growth: 24.35%
Final thoughts
Our mission is to ensure maximal growth for our clients. The substantial improvements in revenue, revenue share, AOV, unique purchases and quantity sold were achieved even before any form of advertisement or promotional campaigns were undertaken for the new stacks.
We believe in laying the groundwork and setting businesses up for success as the foundational step. Once this foundation is in place, we’re set to amplify the results by leveraging paid channels. As we move forward, we remain committed to harnessing data, understanding client needs, and driving transformative changes that resonate not just in numbers but in real business value and customer satisfaction.
For an in-depth look at exactly how these product stacks were created, we invite you to read our blog article.
Piqued your interest ?
CHECK OUT OTHER CASE STUDIES
Want to hear from some of our top digital marketers or directly from our CEO?
GET A FREE CONSULTATION