Case Study
205% Revenue Growth: Your Black Friday eCommerce Blueprint
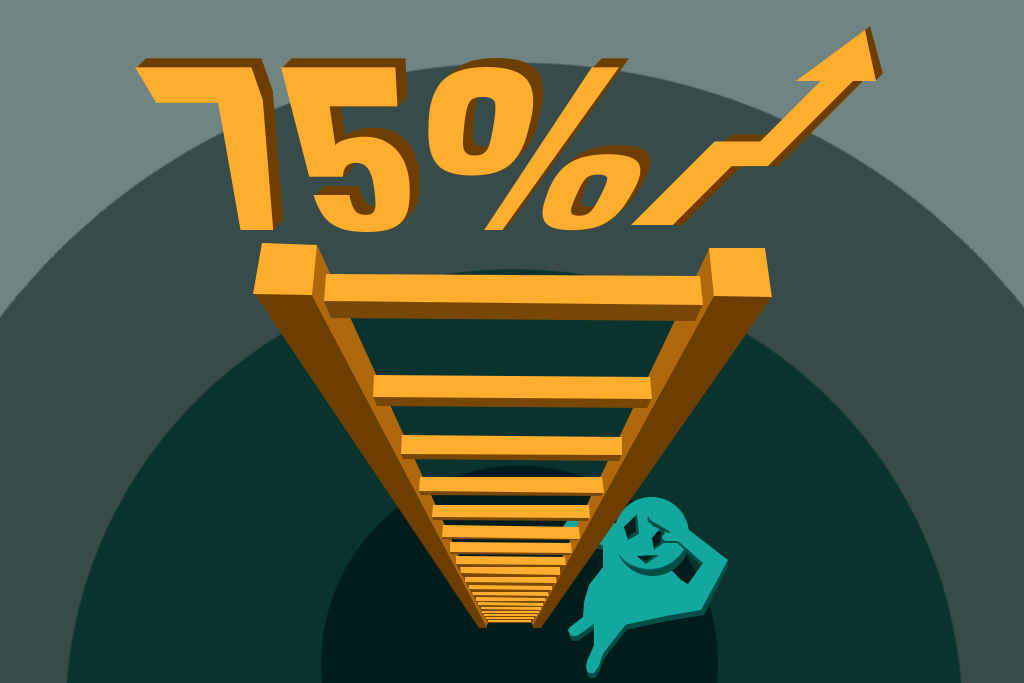
Discover how a specialty apparel eCommerce brand met an ambitious 75% November growth goal—achieving 205% revenue growth—while cutting planned ad spend by 38.7% through agile, data-driven strategies that power results.
Client Overview
This specialty apparel eCommerce brand boasts a strong technological foundation and an experienced team getting ready for an expansion. Their leadership is committed to scaling to the top of their niche—unafraid to test, pivot, and refine strategies to drive results. ROImonks thrives in such agile environments, making our collaboration a true synergy that accelerates growth and fosters ongoing success.
The Challenge
We faced the challenge of increasing November’s revenue by at least 75%, despite the client’s exceptional performance the previous year—November alone had delivered a 284% jump above the monthly average. Achieving this ambitious target required a carefully planned, data-driven strategy.
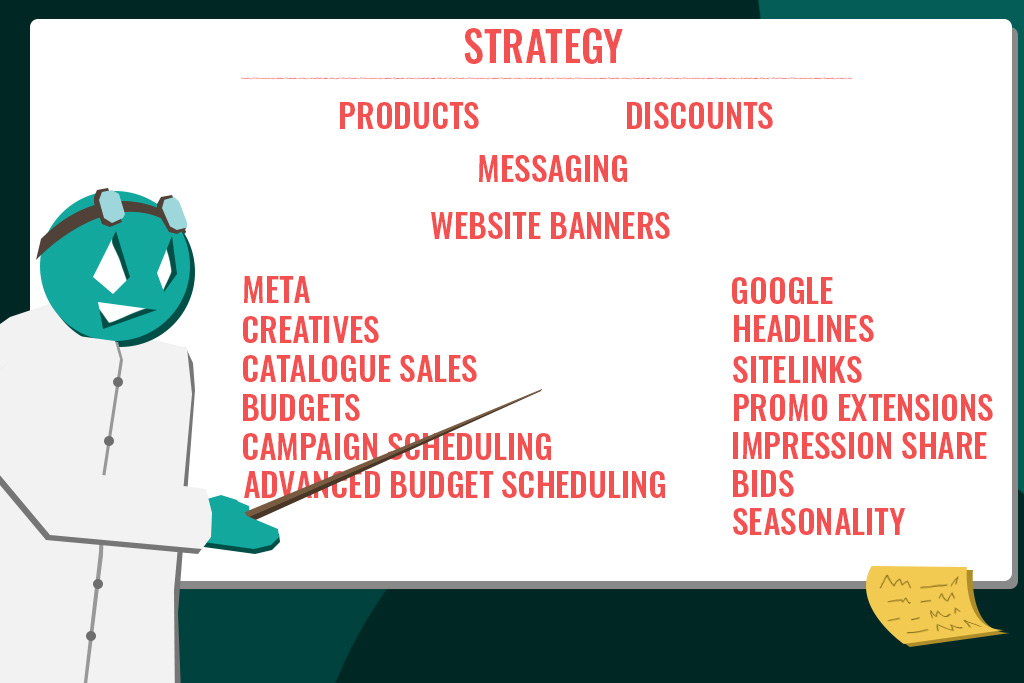
The Strategy
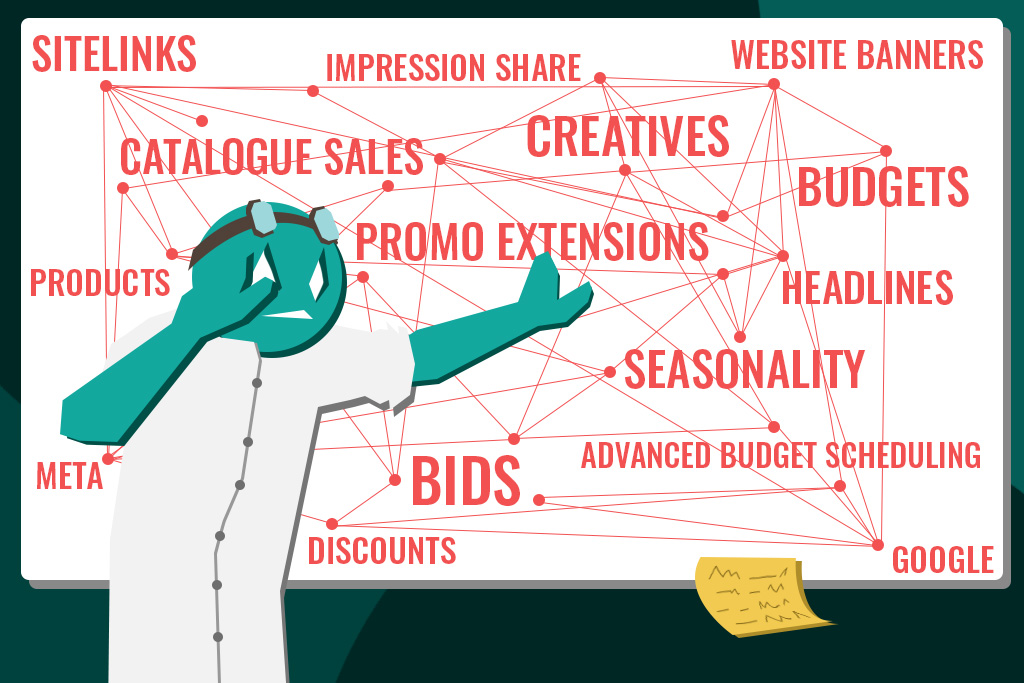
First, we planned the website banners by outlining how many would be used, for which categories and brands, how they would look, and what messages they would include. We made sure everything followed the client’s discount structure.
Next, we mapped out all the Meta campaigns. We focused on key product categories and brands, while leaving room to increase spending on categories that needed extra support.
We then created the briefs for two campaign types—Conversions and Catalogue Sales. For Conversions, we matched the ads to the website banners, ensuring a consistent look across channels. For Catalogue Sales, we used an advanced Enhanced DPA strategy. We started by adjusting our usual templates to include a clear “BLACK FRIDAY” message, original and discounted prices, urgency cues, and product images with brand logos. We also built a simpler template using the same background from our banners and Conversions ads, plus the “BLACK FRIDAY” headline and both prices. To add variety, we requested a few short videos from the client’s creators.
In Google, we wrote promotional headlines, sitelinks, and promotion extensions for all relevant ad groups, making sure the copy matched both keywords and the overall theme. We also launched a campaign targeting competitor brand keywords just before November. This approach let us fine-tune Target ROAS at the campaign level to boost the client’s Absolute Top Impression share, aiming to appear first on the SERP. This is critical during November, when demand can double and the top spot drives the highest returns.
Now that the strategy is ready, it’s time for execution.
Execution
Scheduling: To make the most of every moment, we aligned all Meta campaigns, DPA templates, and Google Ads updates to launch the instant the discounts went live, matching the client’s own schedule.
Real-Time Measurement: We continuously tracked performance, making multiple budget adjustments each day and refining product sets, Target ROAS, and seasonality adjustments to drive maximum revenue.
Results
Seven days into the promotion, the client requested a budget reduction because they couldn’t keep up with the surge in orders. We had been on track to surpass the previous year’s total revenue in just one month, but overwhelming their fulfillment capacity could cause long-term issues. Instead, we took a strategic approach to lowering budgets, favoring underperforming categories over the top seller. The client valued balanced growth across all categories, so by focusing on the areas that needed extra attention, we could acquire new customers now and nurture them throughout the coming year. Here are the metrics:
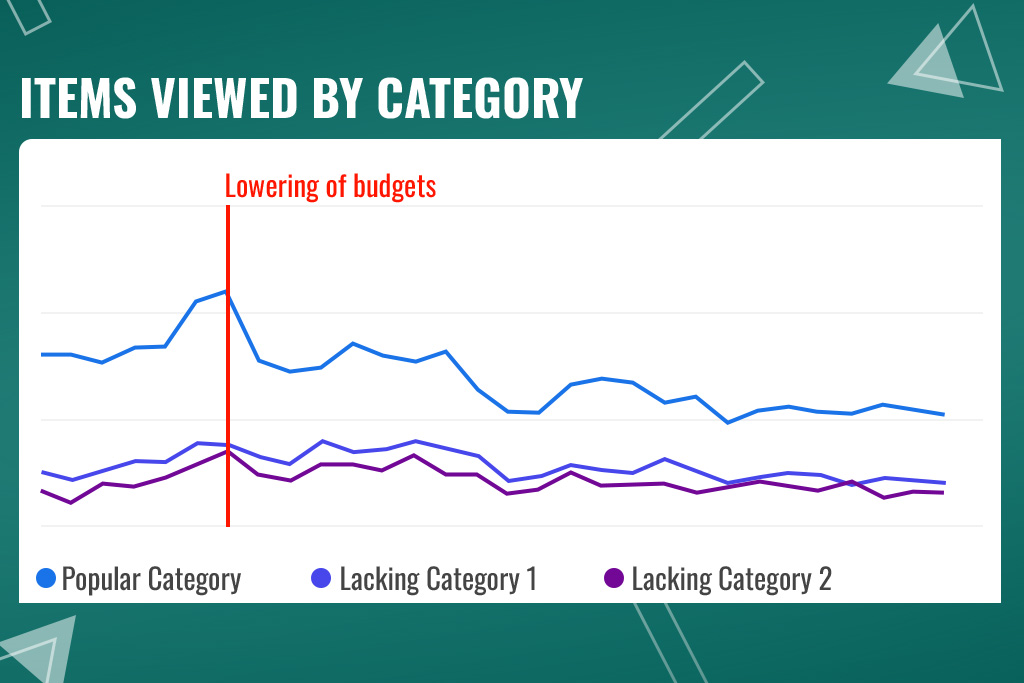
Items viewed by category
As shown here, we kept views steady for “lacking category 1” and “lacking category 2” while temporarily reducing views for the “popular category.” This helped us regulate overall orders and simultaneously acquire new users for underperforming categories
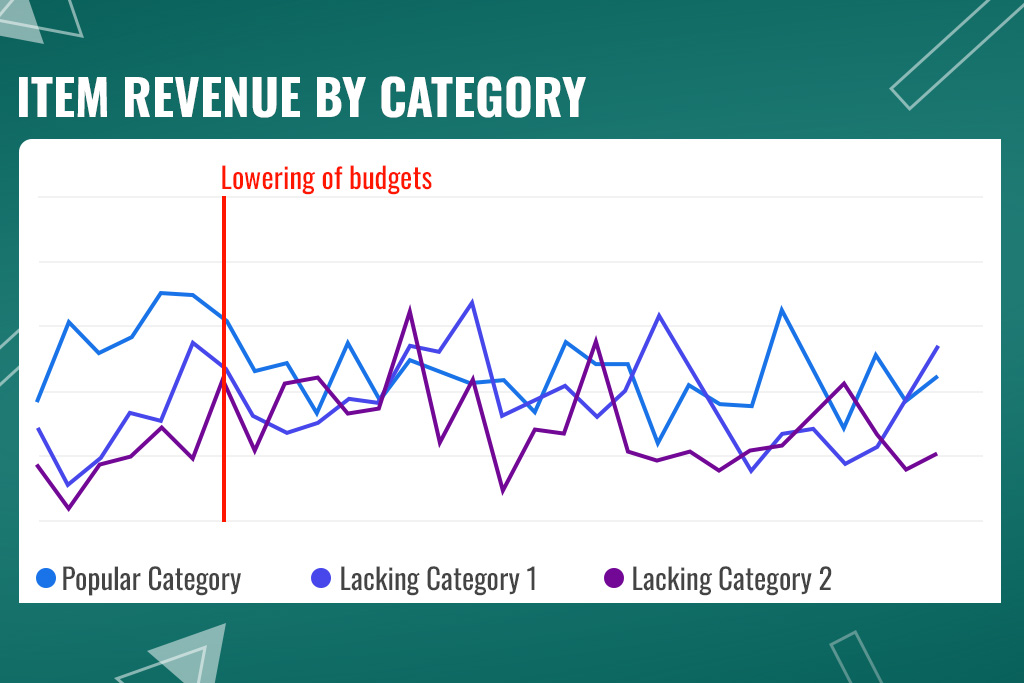
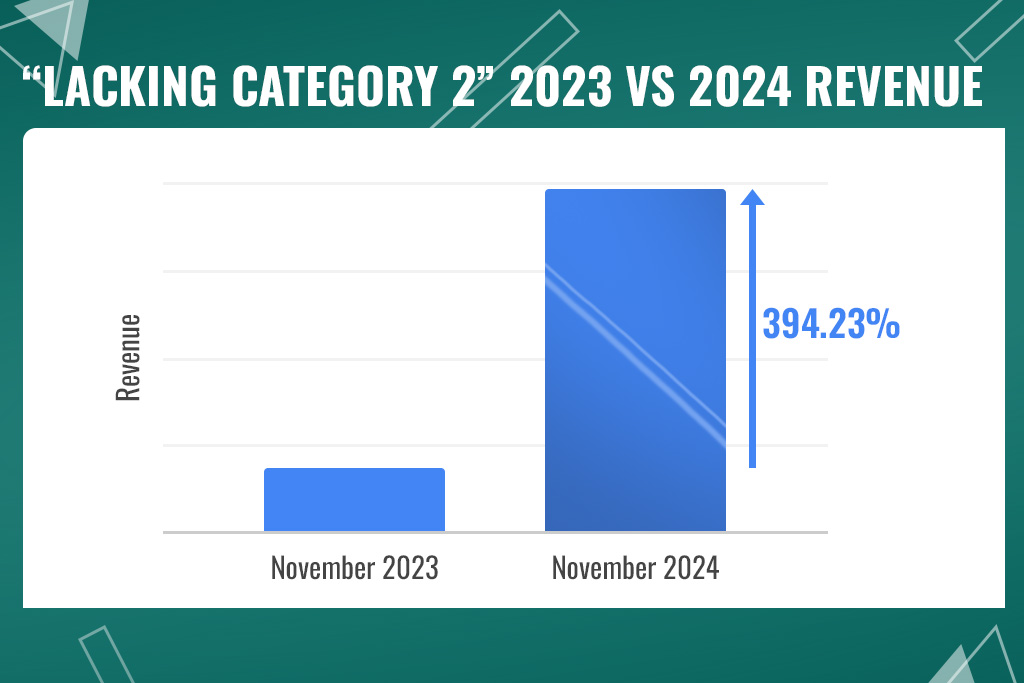
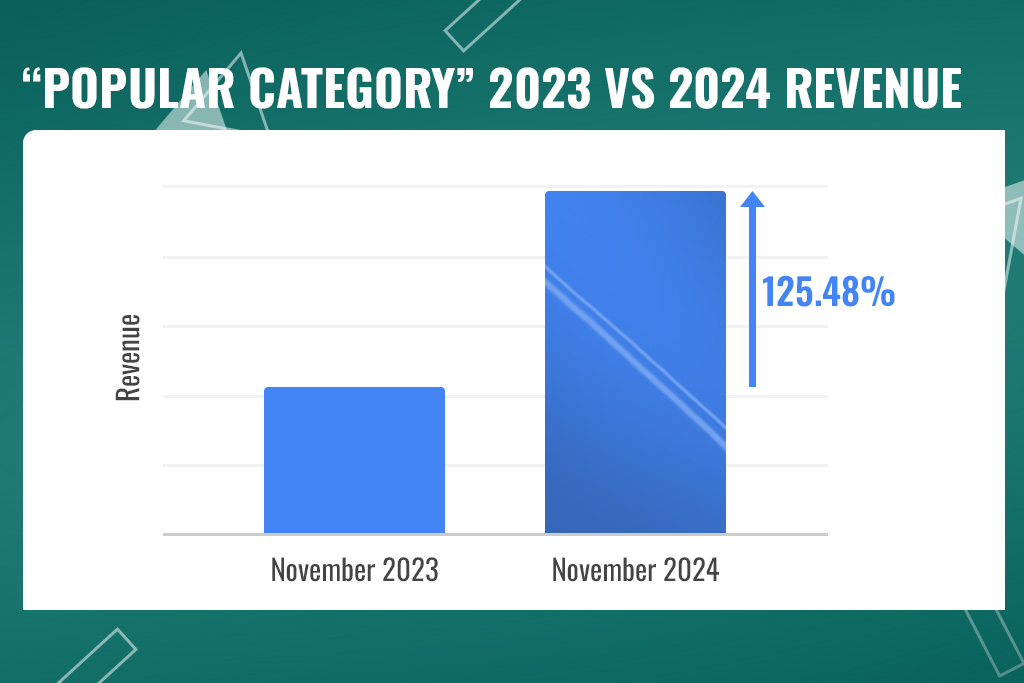
Item revenue by item category
Reducing item views in the “popular category” directly affected its revenue, confirming that our strategy was both effective and under precise control.
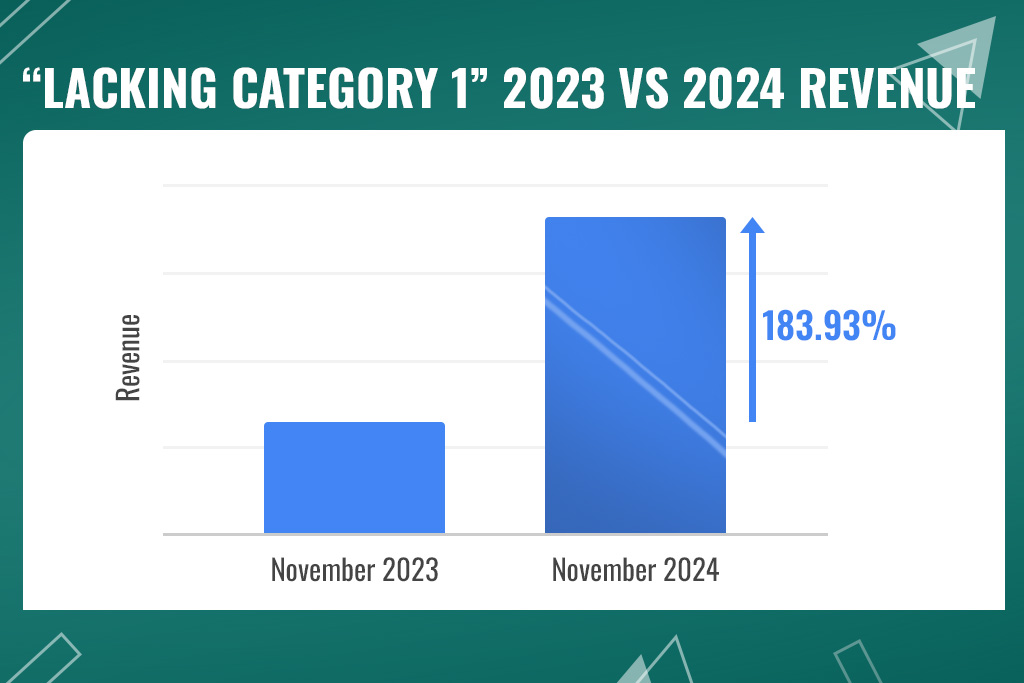
YOY growth by category
Revenue of “lacking category 1” grew by 183.93%
Revenue of “lacking category 2” grew by 394.23%
Revenue of “popular category” grew by 125.48%
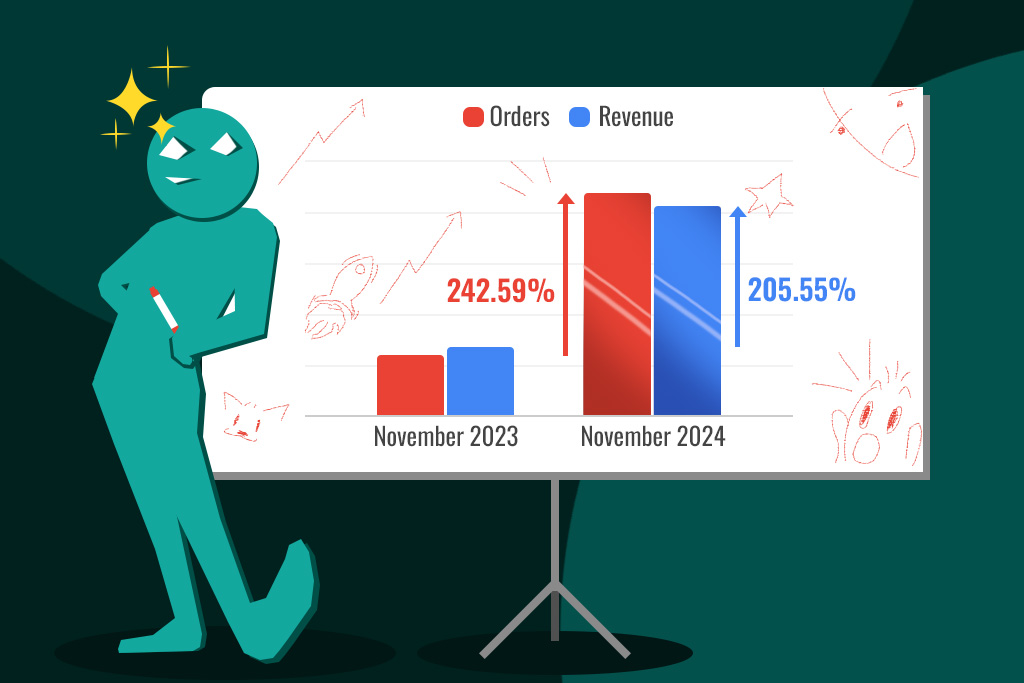
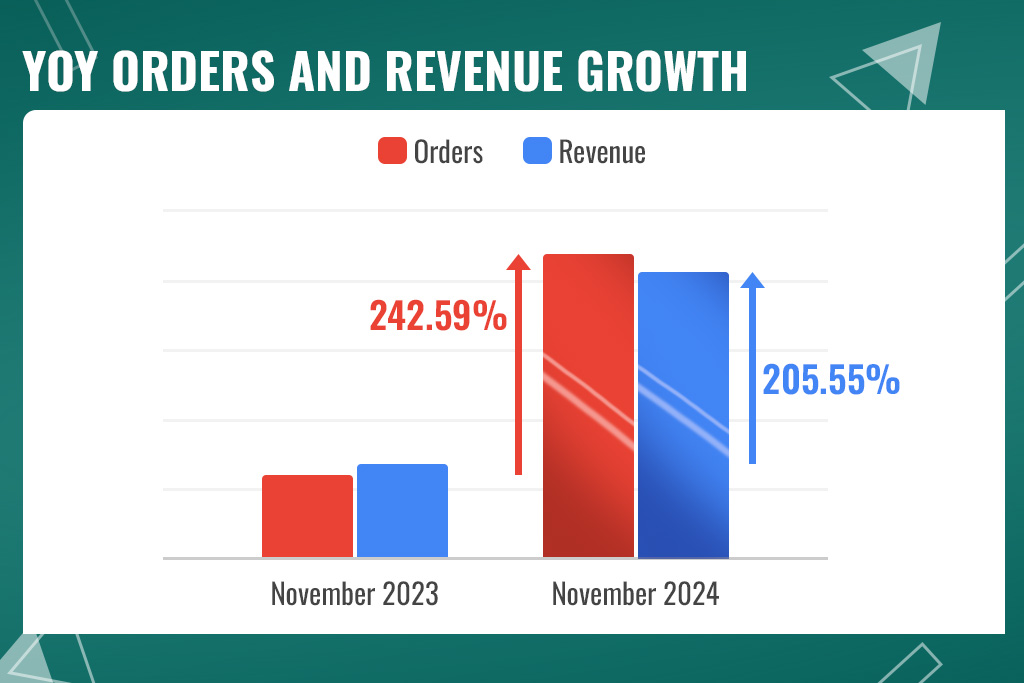
Overall YOY growth
Orders grew by 242.59%
Revenue grew by 205.55%
Cost-savings
All of this was accomplished with 38.7% less ad spend than originally planned.
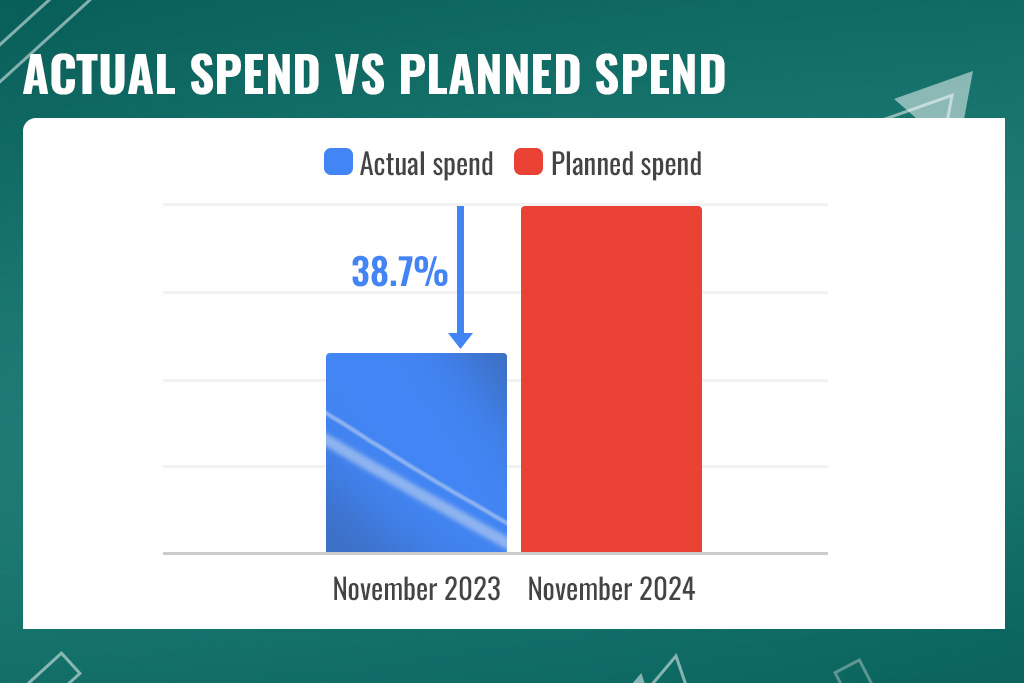
In just one month, orders surged by 242.59%, and revenue rose by 205.55%, despite spending 38.7% less on ads than initially planned.
Key Takeaways for your eCommerce Business
This case study highlights several lessons that can help your eCommerce business grow, especially during high-demand periods like November. Here’s what you can take away:
1. Plan in Advance
Begin with a solid strategy that covers everything from website banners to ad creatives. Tie together products, discounts, and messaging for a unified approach.
2. Focus on Key Categories and Products
Identify your top performers and those needing extra support. By structuring campaigns around high-demand items while also boosting underperformers, you can balance revenue growth across the business.
3. Leverage Advanced Advertising Techniques
Use Enhanced DPA templates and targeted messaging to highlight urgency, compare old and new prices, and maintain consistent visuals. Although these approaches require extra time and effort, they can deliver game-changing results.
4. Optimize in Real Time
Launching campaigns is just the start. Keep a close eye on live data and adapt your budgets, product sets, and bids on the fly to maximize performance.
5. Think Long Term
Rapid growth matters, but so does overall sustainability. Invest strategically in weaker categories to attract new customers today and secure stronger returns tomorrow.
The results of this campaign demonstrate how a focused, data-driven strategy can turn even high-pressure sales periods into record-breaking opportunities.
Ready to Transform Your Online Sales?
Ready to see real results? Our proven strategies deliver the growth you need—efficient, scalable, and tailored to your goals. Contact us today to transform your eCommerce performance.
Piqued your interest ?
CHECK OUT OTHER CASE STUDIES
Want to hear from some of our top digital marketers or directly from our CEO?
GET A FREE CONSULTATION